EmbryoAPA
Alternative Polyadenylation in Mammalian Preimplantation Embryonic Development
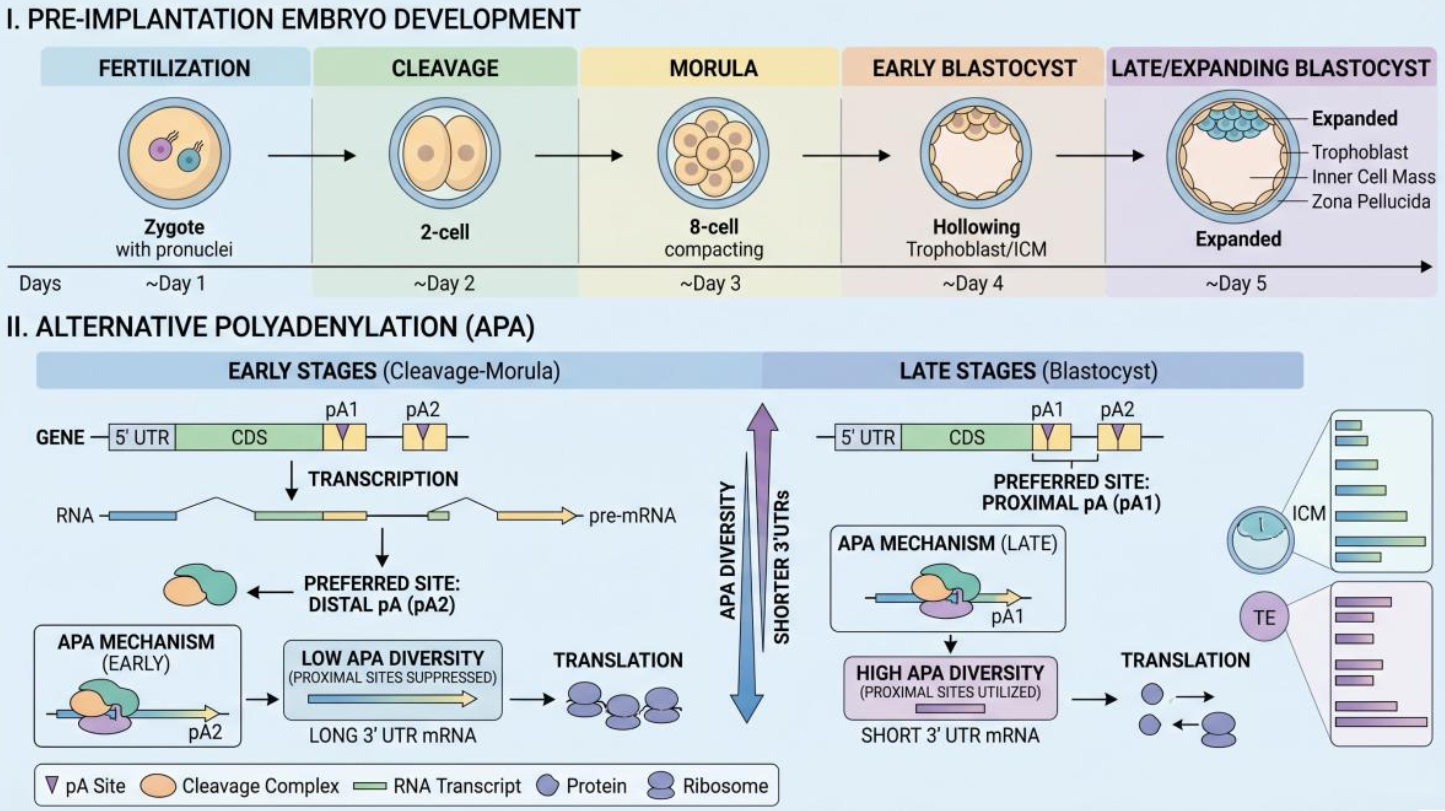
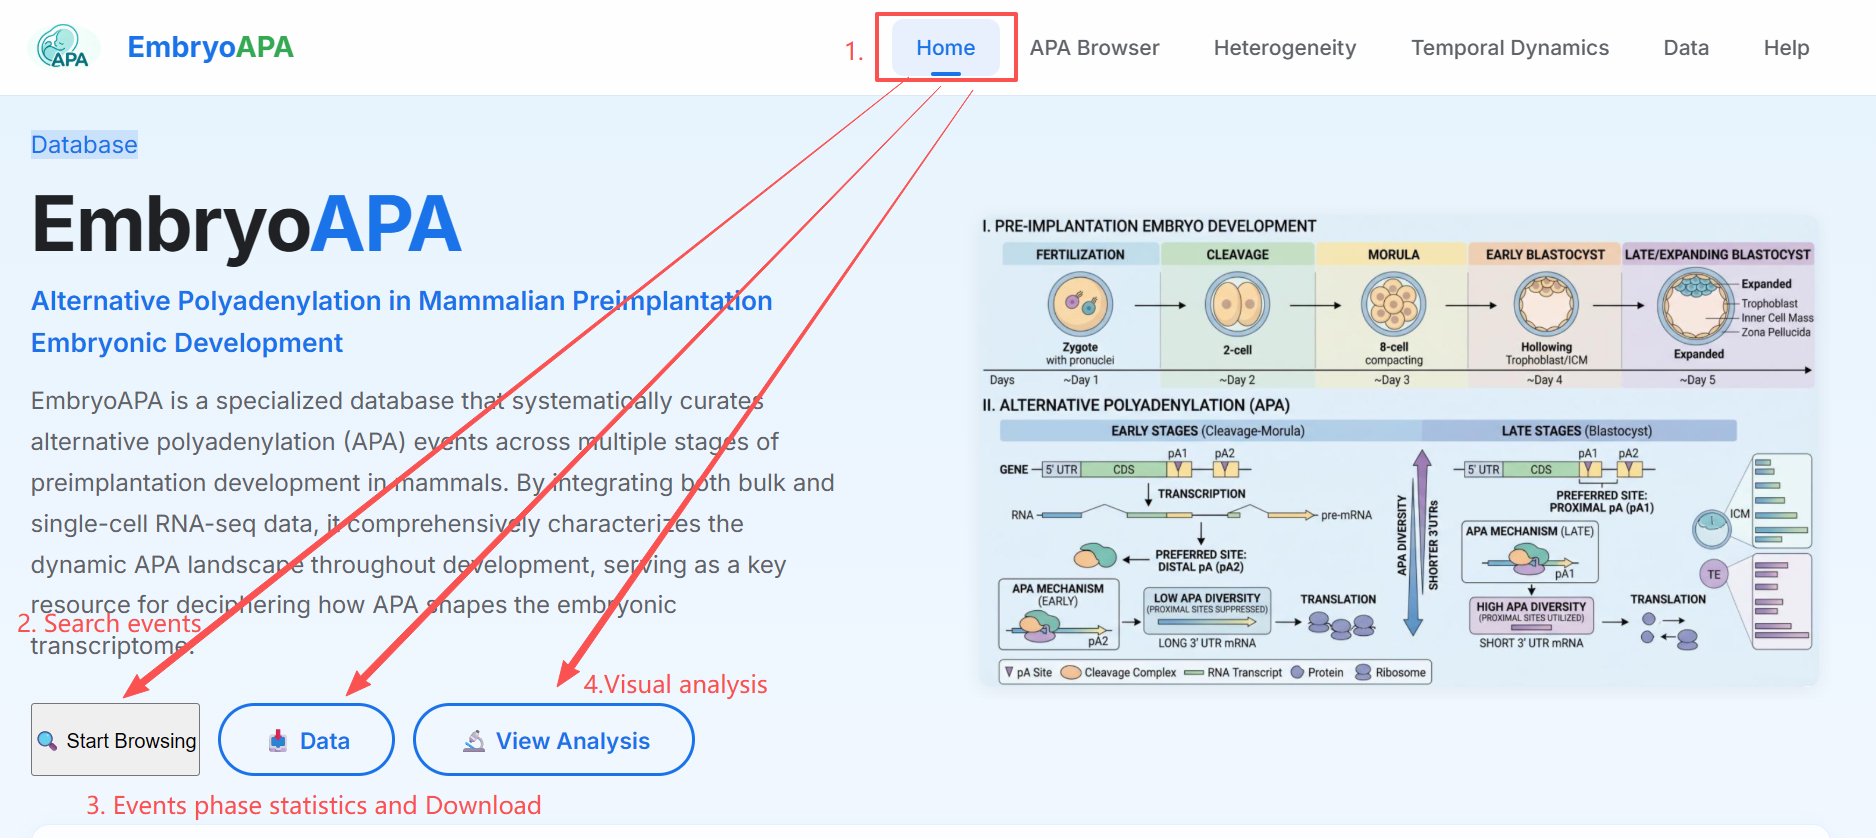
EmbryoAPA is a specialized database that systematically curates alternative polyadenylation (APA) events across multiple stages of preimplantation development in mammals. By integrating both bulk and single-cell RNA-seq data, it comprehensively characterizes the dynamic APA landscape throughout development, serving as a key resource for deciphering how APA shapes the embryonic transcriptome.
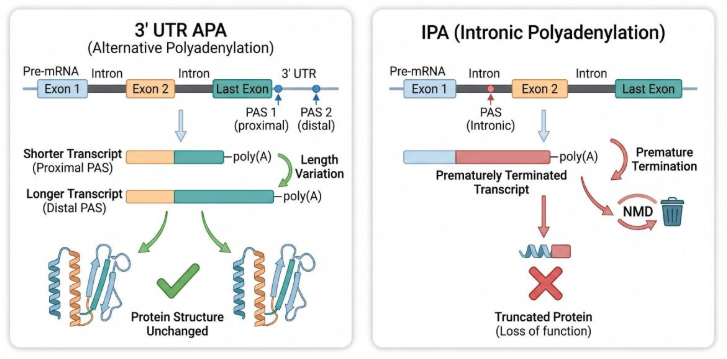
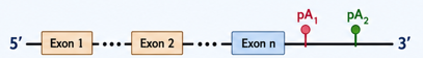
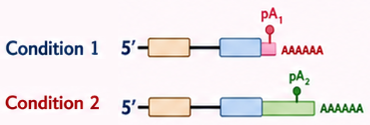
3' UTR APA and IPA
Schematic of two main APA mechanisms in our database.
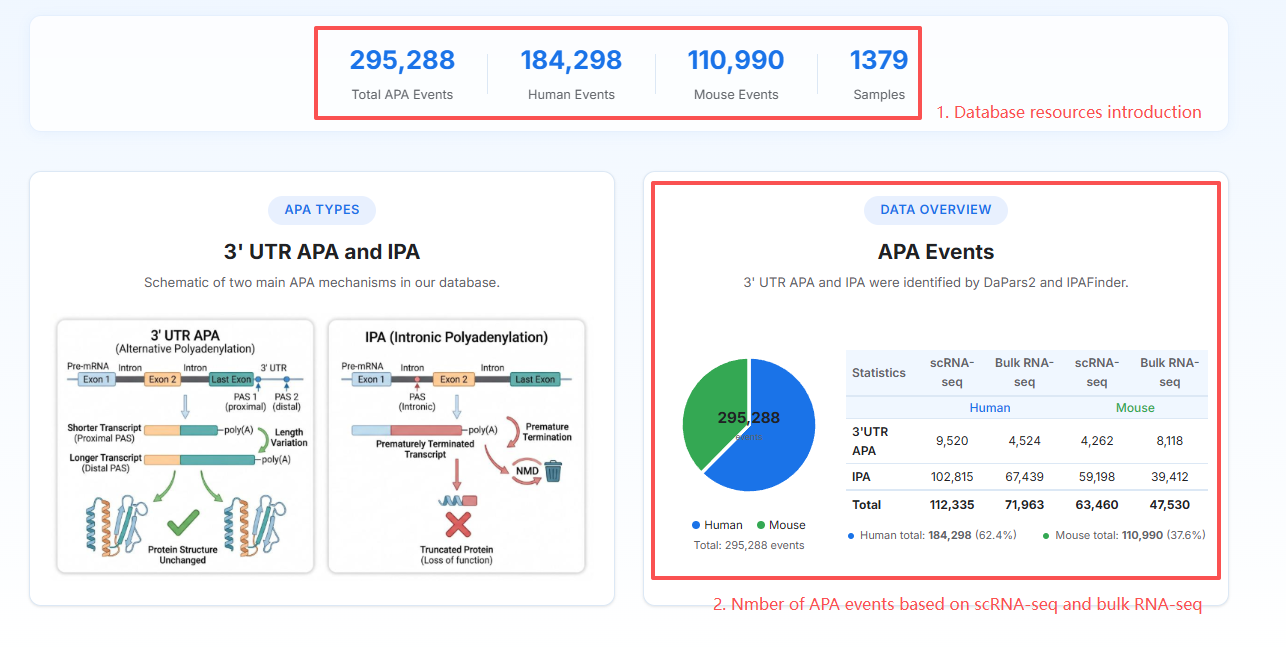
APA Events
3' UTR APA and IPA were identified by DaPars2 and IPAFinder.
| Statistics | scRNA-seq | Bulk RNA-seq | scRNA-seq | Bulk RNA-seq |
|---|---|---|---|---|
| Human | Mouse | |||
| 3'UTR APA | 9,520 | 4,524 | 4,262 | 8,118 |
| IPA | 102,815 | 67,439 | 59,198 | 39,412 |
| Total | 112,335 | 71,963 | 63,460 | 47,530 |
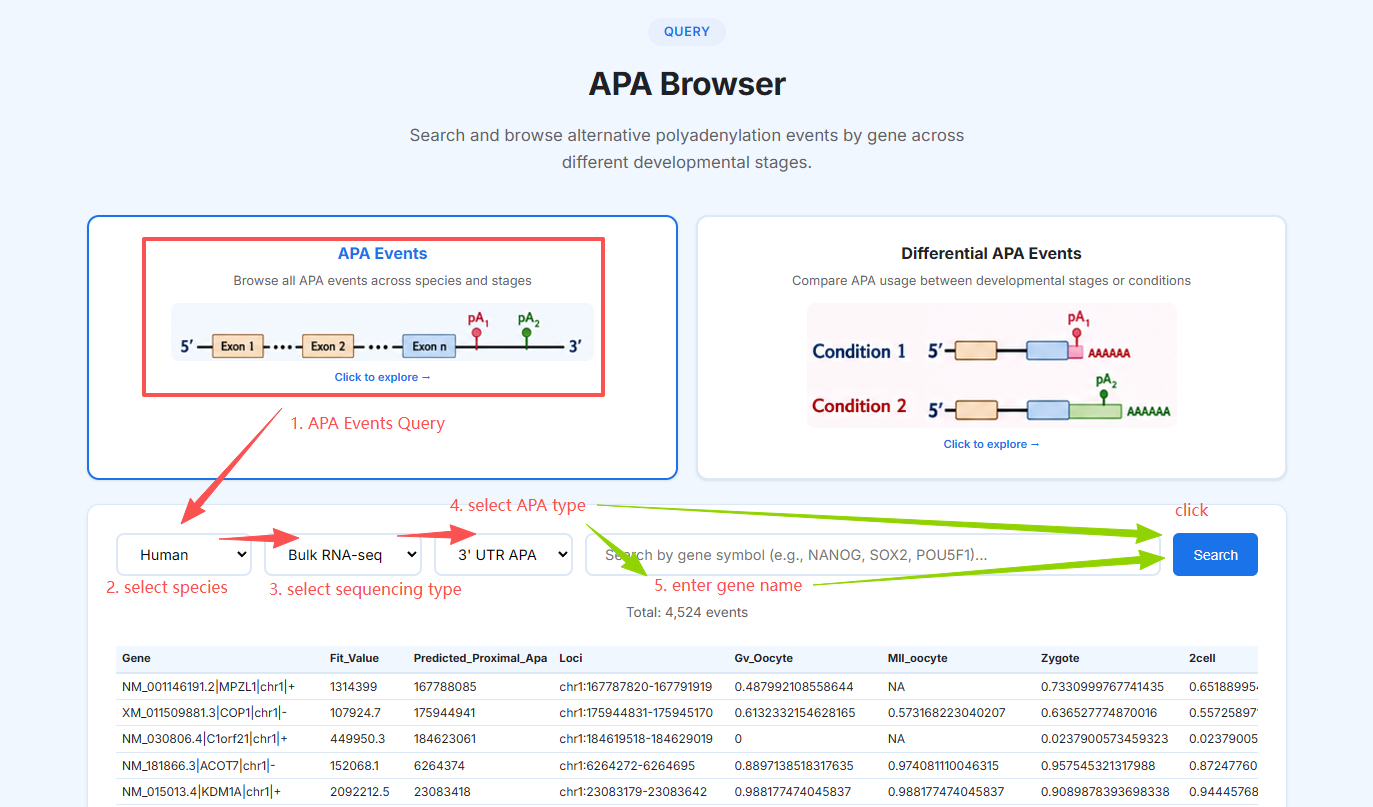
APA Browser
Search and browse alternative polyadenylation events by gene across different developmental stages.
APA Events
Browse all APA events across species and stages
Click to explore →
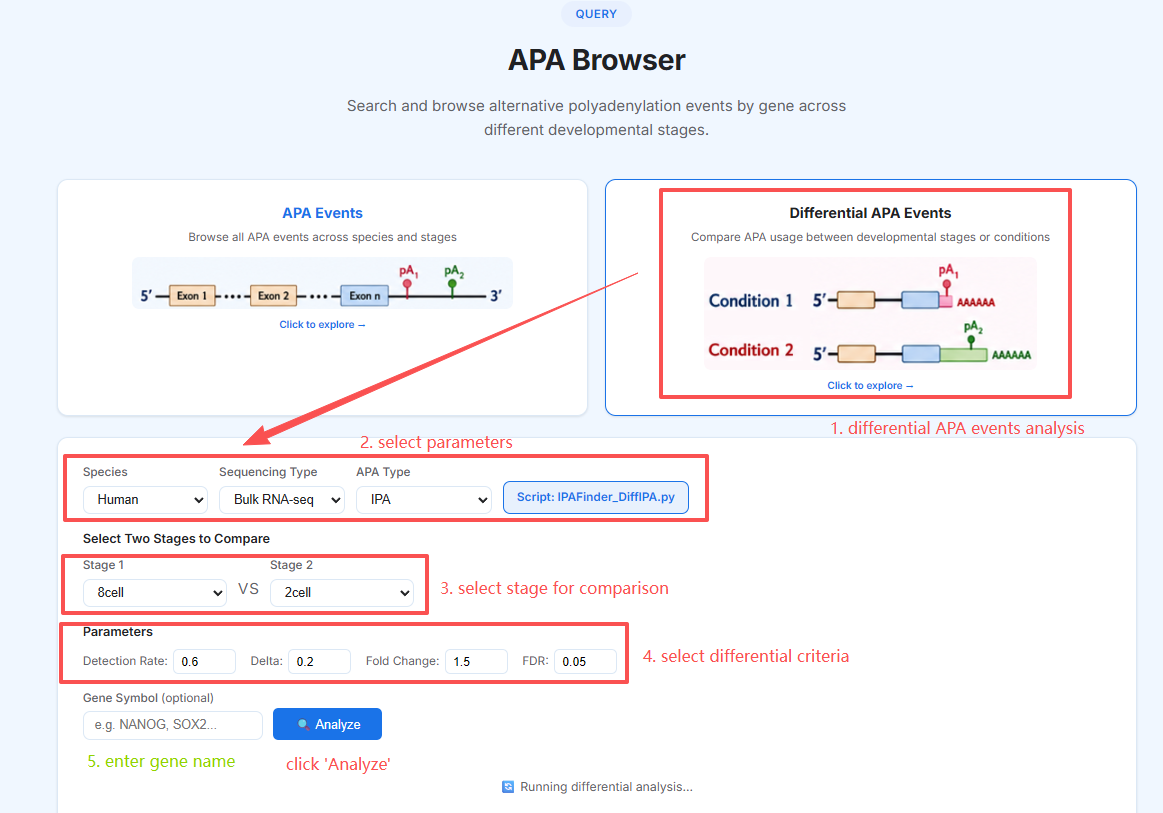
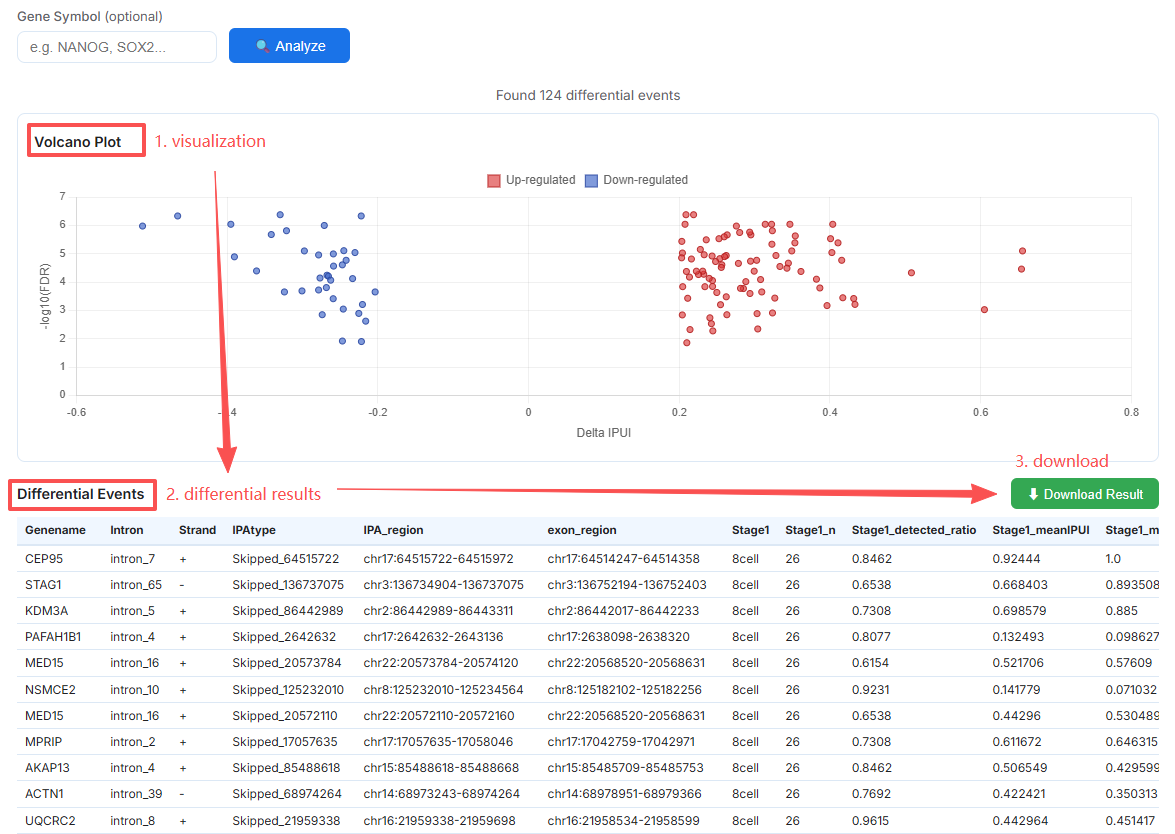
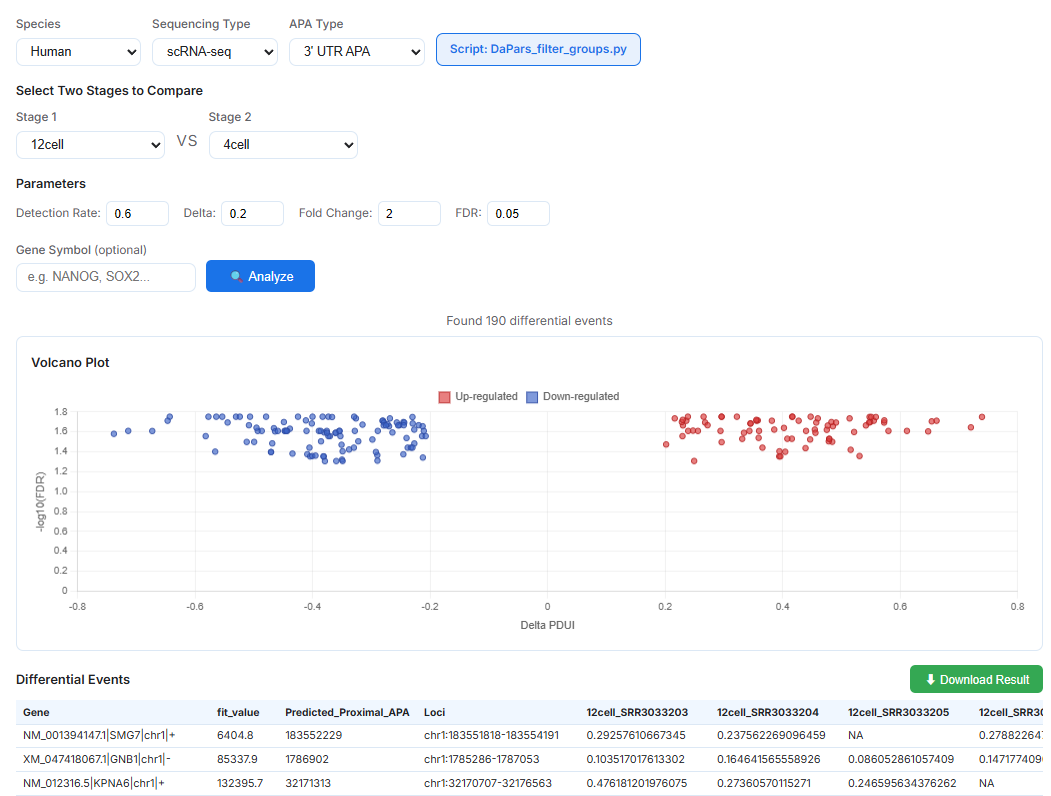
Differential APA Events
Compare APA usage between developmental stages or conditions
Click to explore →
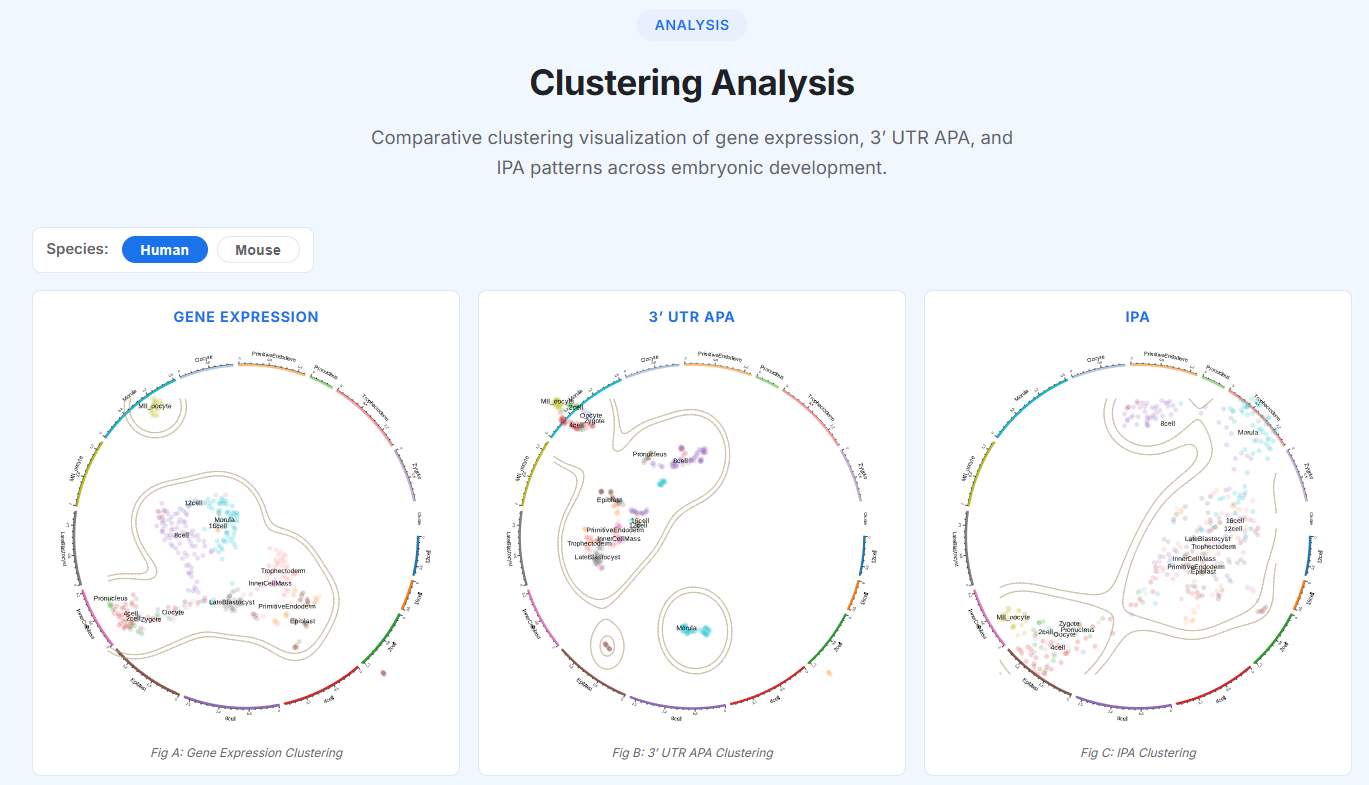
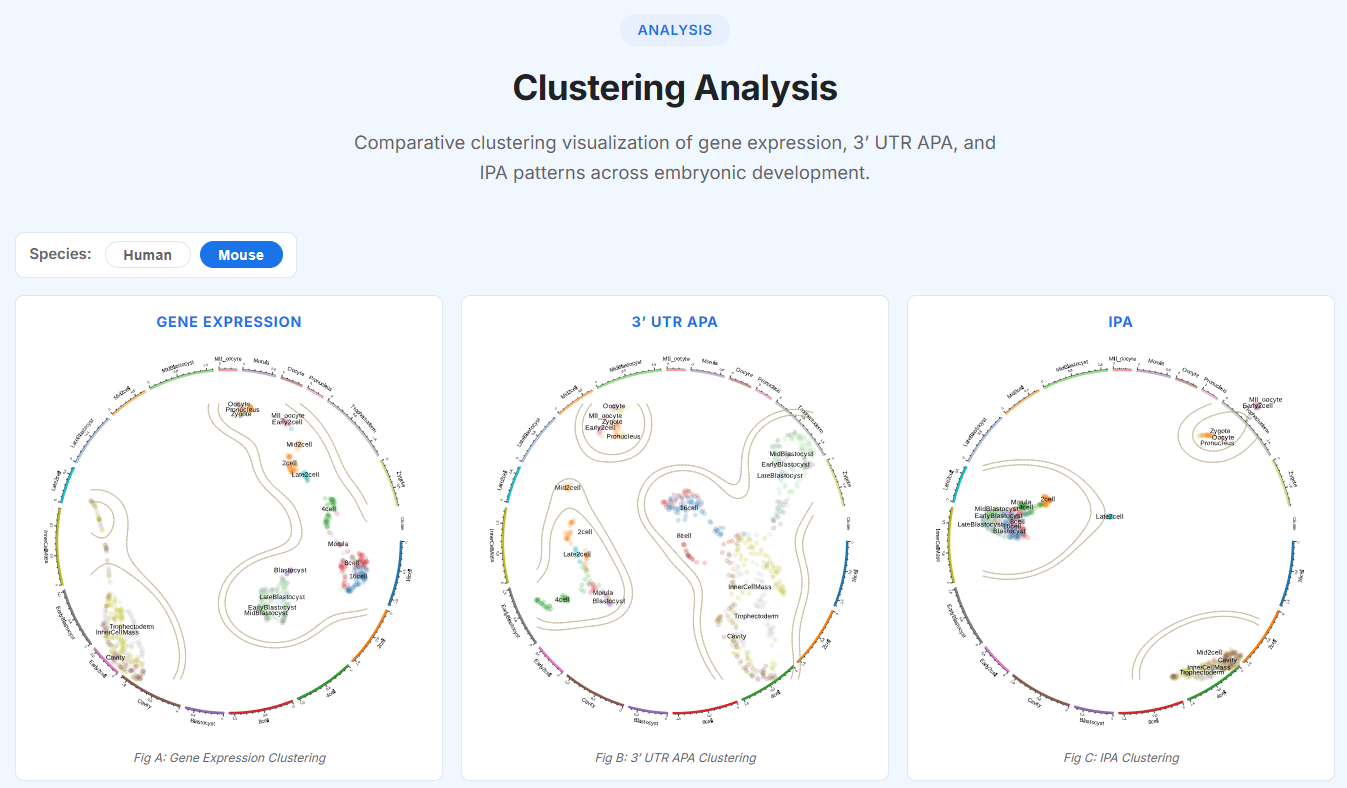
Clustering Analysis
Comparative clustering visualization of gene expression, 3’ UTR APA, and IPA patterns across embryonic development.


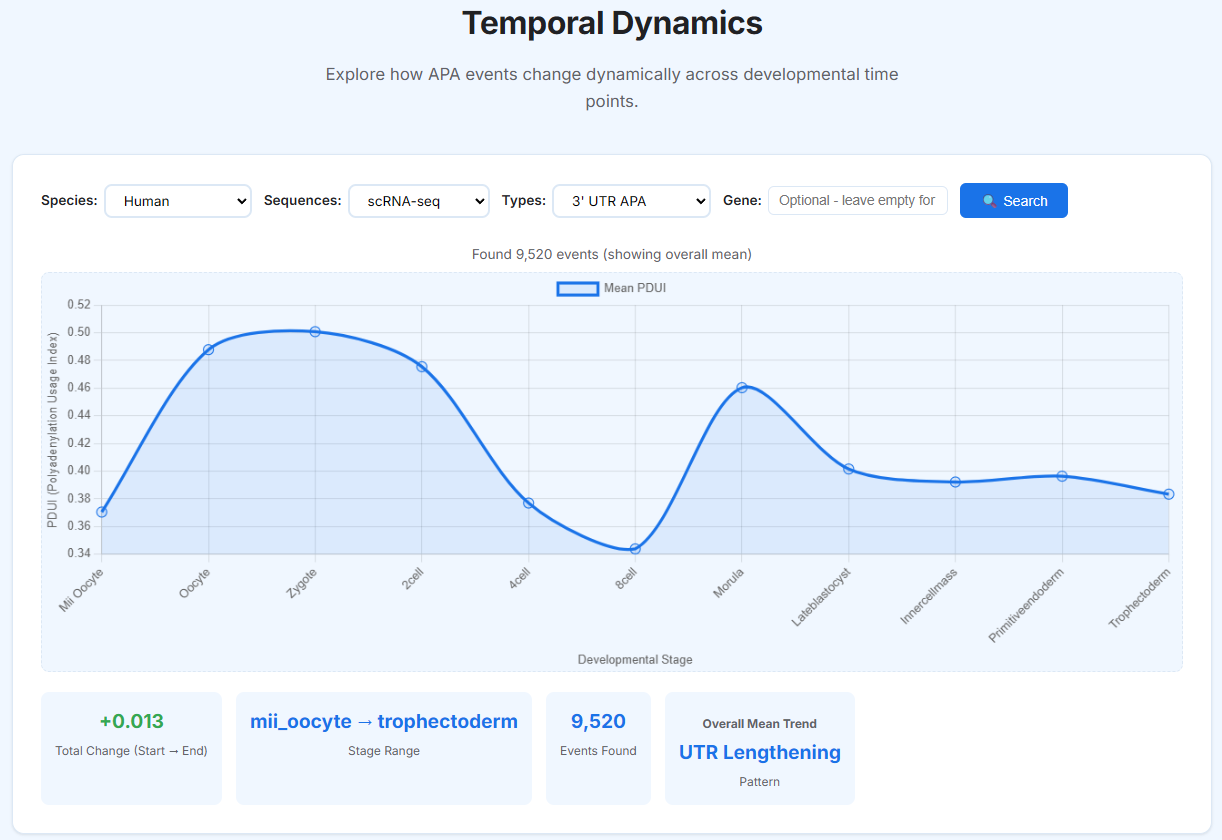
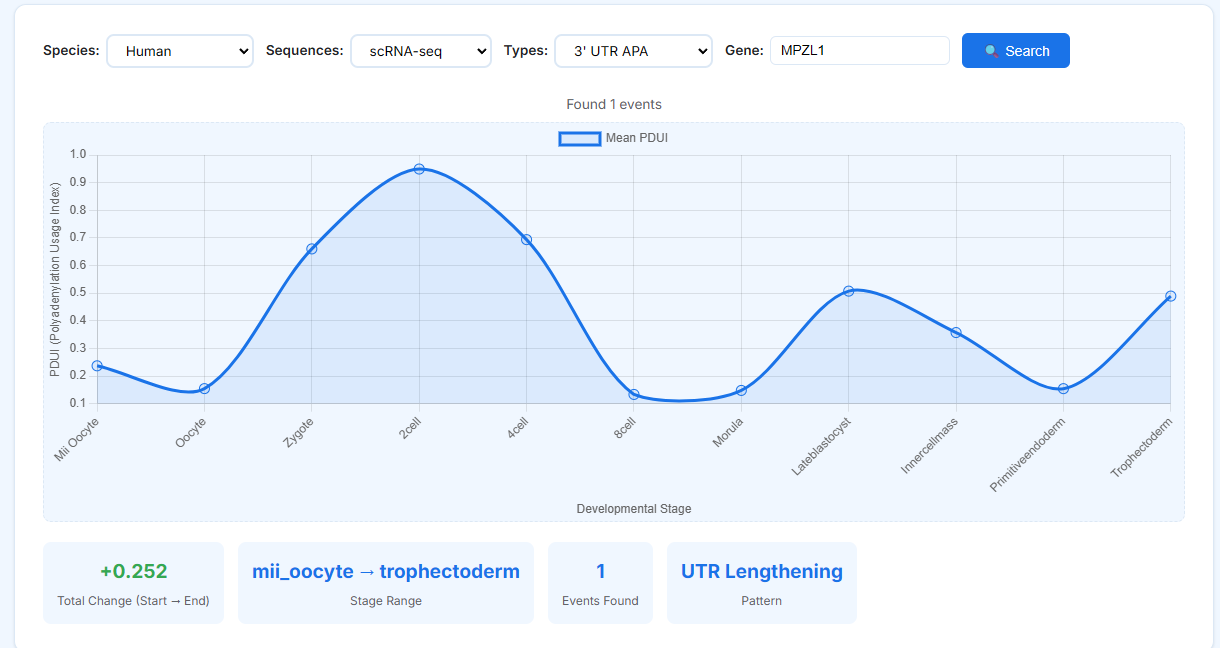
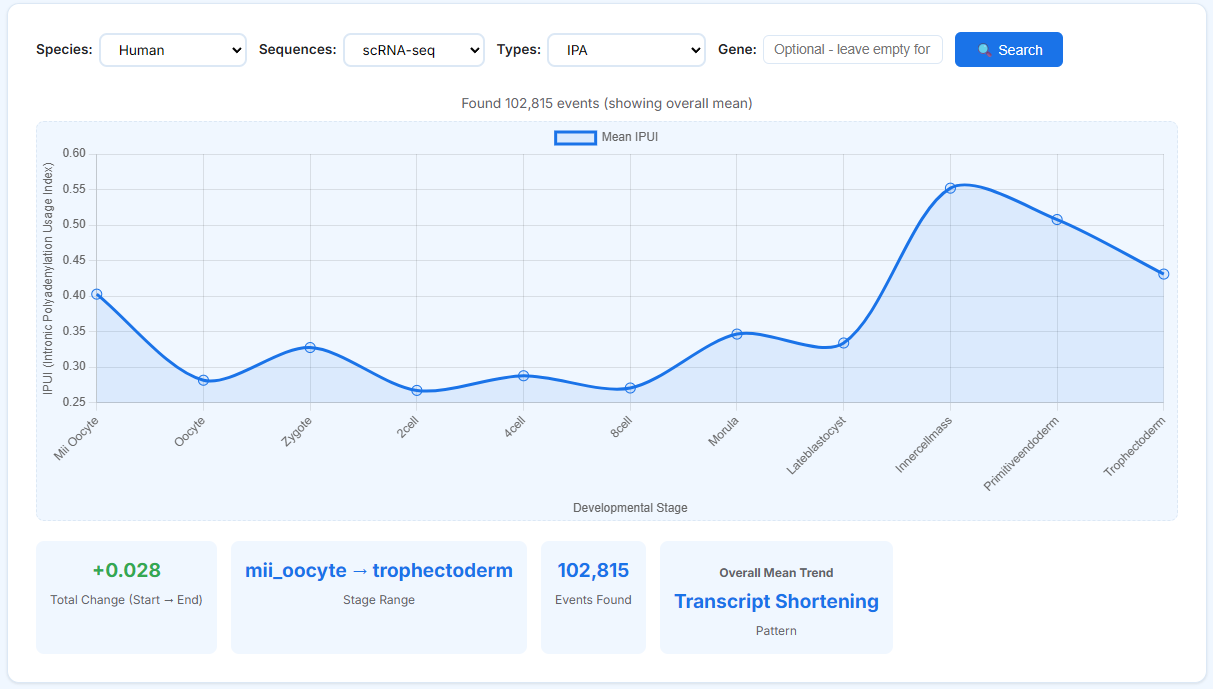
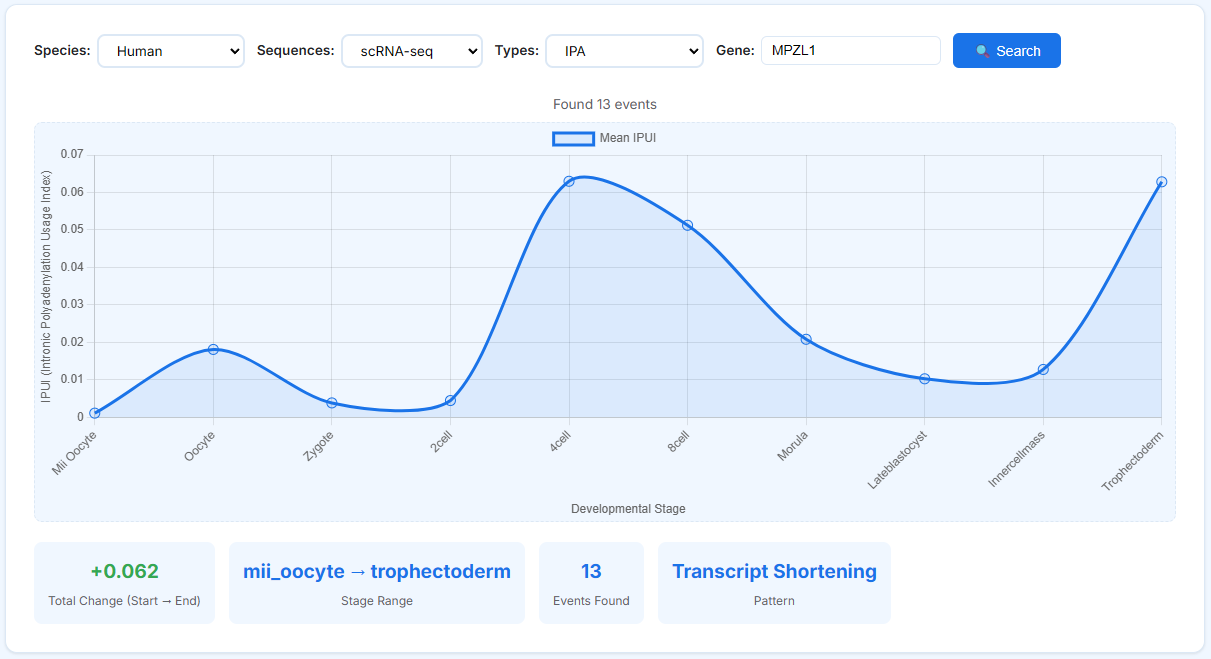
Temporal Dynamics
Explore how APA events change dynamically across developmental time points.
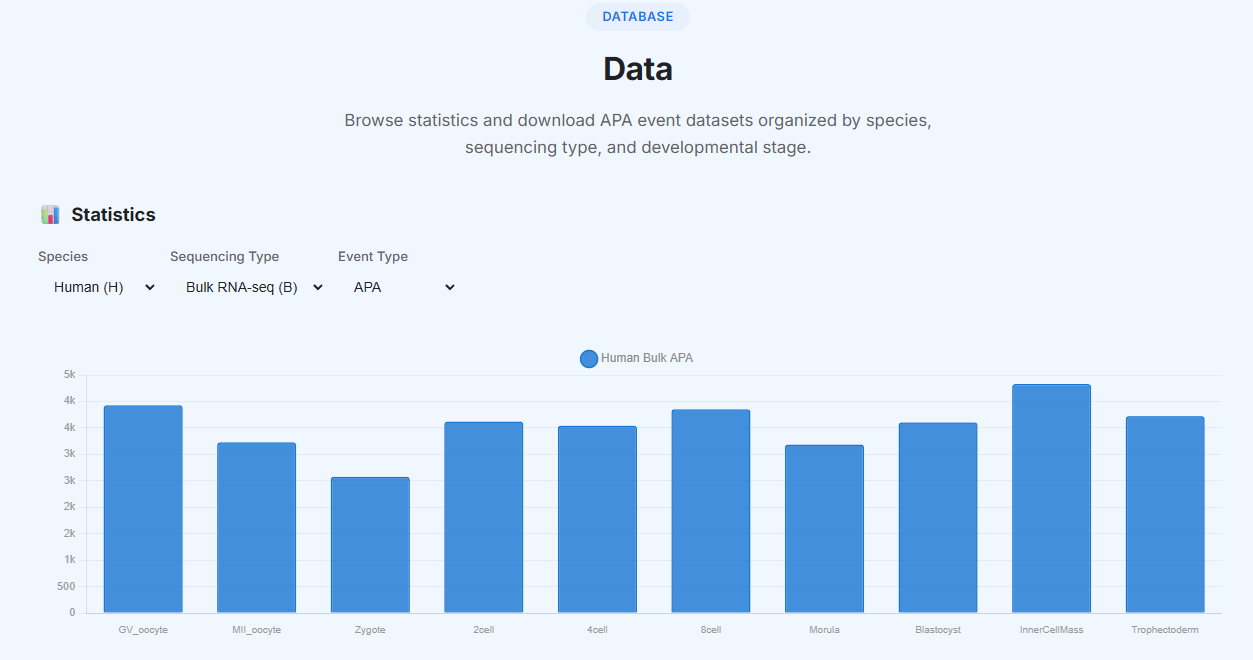
Data
Browse statistics and download APA event datasets organized by species, sequencing type, and developmental stage.
📊Statistics
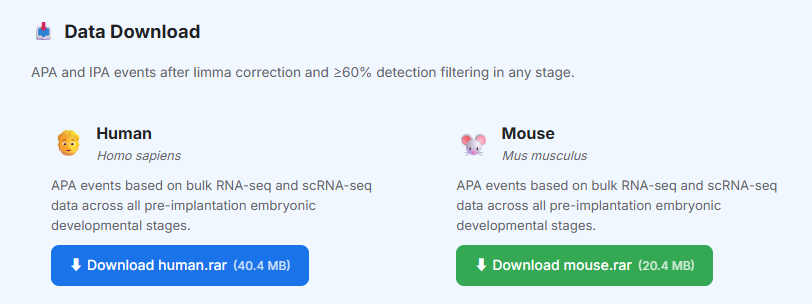
📥Data Download
APA and IPA events after limma correction and ≥60% detection filtering in any stage.
APA events based on bulk RNA-seq and scRNA-seq data across all pre-implantation embryonic developmental stages.
⬇ Download human.rar (40.4 MB)APA events based on bulk RNA-seq and scRNA-seq data across all pre-implantation embryonic developmental stages.
⬇ Download mouse.rar (20.4 MB)Help & Documentation
Get started with EmbryoAPA. Browse tutorials, FAQs, and detailed documentation.
📖Quick Start Guide
Navigate to APA Browser, select species, sequencing type, and APA type, then search by gene symbol.
In APA Browser, switch to "Differential APA Events", select two developmental stages and parameters to identify significant changes.
Visit Heterogeneity to compare gene expression, 3' UTR APA, and IPA clustering across species.
Use Temporal Dynamics to visualize how APA usage changes across developmental stages.
Go to Data to access statistics and download filtered APA event datasets.
📘Instructions
Screenshots of each module to help you get familiar with the EmbryoAPA interface.
🏠 Home Page
🔍 APA Browser
🔬 Clustering Analysis (Heterogeneity)
📈 Temporal Dynamics
📊 Data
❓Frequently Asked Questions
Mouse: Oocyte, MII oocyte, Sperm cells, Zygote, 2-cell (early/mid/late), 4-cell, 8-cell, 16-cell, Morula, 32-cell, Blastocyst (early/mid/late), Inner Cell Mass, Trophectoderm, Cavity. Not all stages are available for every sequencing type.